How to Measure Incremental Sales?
A Marketer’s Guide to Measuring Incremental Sales
As marketers, we’re always on the hunt for new ways to measure our efforts. While we love a good UTM or Facebook Pixel, these tactics don’t always show the whole picture and can be complicated to install and analyze. Sometimes we just need to know if a marketing tactic is working by answering the simplest possible question: Are we making money, or losing it?
Enter incremental sales, an easy way to calculate your success by answering just that. If you’re looking for a way to determine whether your performance marketing efforts are fabulous or flopping, calculating incremental sales can help.
Incremental sales is a commonly used KPI by many marketing executives to better understand the efficacy of their marketing campaigns. If you calculate your incremental sales and the number is positive, that’s a good thing. If it’s negative, it’s a great indicator that it’s time to revisit your marketing efforts and shake things up.
The goal of an incremental sales KPI is to provide business leaders an actionable metric that determines if their marketing efforts are worth additional contribution. If the Incremental Sales KPI indicates that their campaigns are yielding more sales than if they had not done the campaign, then they can confidently acknowledge that their efforts were a success.
Understanding your company's high level goals, you must translate them into KPIs. These KPIs help you make strategic decisions and best allocate budget towards the different types of ads you want to run. We've created a helpful guide on the different types of advertising here.

Their most recent marketing campaign was centered around a Facebook ad they ran with a video to promote their museum. Throughout the previous year, they spent $10,000 running the ad. Luckily for them, the ad received lots of clicks and conversions on their site.
Throughout the past year, they saw growth in new users, an increase in sessions per user and more ticket sales sold online. They were excited about the results, but wanted to better understand if it was a direct result of the ad or if their museum’s reputation is growing through word of mouth and recent press. The question they are looking to answer is, how to measure incremental sales?
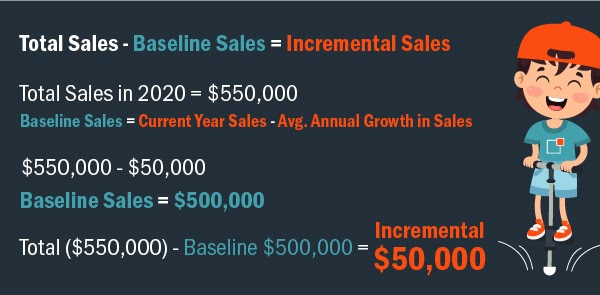
Total Sales - Baseline Sales = Incremental Sales
To measure incremental sales we simply calculate the difference between your total sales and your baseline sales. Baseline sales are a measure of your company’s expected sales revenue, with no additional boost from marketing efforts.
Unfortunately, you as the business owner are going to have to make some educated guesses and assumptions about your baseline sales in order to calculate them. One factor to consider is your annual average sales revenue growth. This number provides the basis for comparison.
One method would be to consider the past 3-5 years of sales revenue and look at the growth each year to predict what you would have expected your sales to be in the next year. This number would be the current year’s sales revenue minus the previous year’s sales revenue. For example: Based on our table below, 2018’s sales growth would have been $50,000 (2018 SR - 2017 SR).
Note that this example assumes paid marketing efforts were limited or nonexistent in past years. If you did spend money on advertising in prior fiscal years, you will have to return to the educated guess model and work to subtract ad-based revenue from your total sales to arrive at a baseline number.
Assuming last year was the first year your company spent money on advertising efforts, you may move forward with this example model. In the case of The International Pogo Stick Museum, their sales grew slowly around $50,000 in additional revenue each year with $0 spent on advertising. We’ve plotted their sales over the last 4 years below.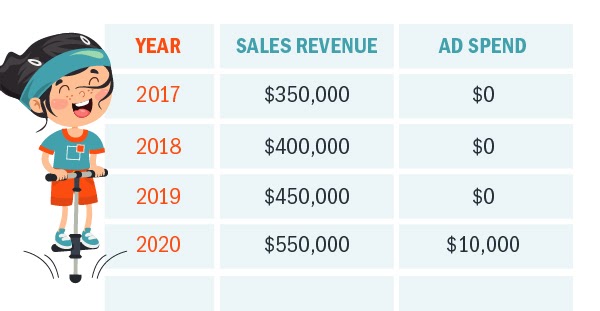
As you can see their sales had been growing by $50,000 per year at a very steady rate, but when they spent $10,000 on ads in 2020, their revenue grew by $100,000. A huge mistake would be to attribute all $100,000 to the Facebook Ad. It’s more reasonable to expect that a number close to $50,000 would be coming from their expected baseline growth, and that the Facebook Ad is responsible for a number closer to $50,000.
Imagine if the total sales revenue had only been $500,000 in 2020. If the museum’s digital marketer failed to recognize the baseline sales revenue, they may falsely believe that their campaign drove $50,000 in revenue when the business was likely to already capture some of those sales.
So let’s review:
Incremental ($50,000)
With all of this information and a solid incremental sales number, the International Pogo Stick Museum can rest assured that their marketing efforts on Facebook ads were a success. Their more nuanced reporting of this KPI can help them better understand where sales growth came from that was not trackable inside of the Facebook Ads Manager.
If someone sees a video on Facebook, likes what they see, gets distracted and later tells a friend about the International Pogo Stick Museum, that Facebook ad may have been responsible, but we can’t concretely measure it. There are countless different ways someone could be affected by a digital ad and act later in a way that isn’t measurable. Measuring incremental sales works in tandem with more typical performance marketing tools like UTMs to help you better understand the impact of your efforts and measure what you can.
To accurately determine the value of your incremental sales, it’s important to have a detailed understanding of a few other key performance indicators.
Key Terms to Understand:
At the end of the day, this method is a tool for your marketing toolbox, just like any other. Try it out and see if it works for you!
Enter incremental sales, an easy way to calculate your success by answering just that. If you’re looking for a way to determine whether your performance marketing efforts are fabulous or flopping, calculating incremental sales can help.
What are Incremental Sales?
Incremental Sales is a business concept that measures the difference between the sales revenue your business normally earns without marketing efforts against your total sales revenue after marketing efforts are launched. It’s a simple way to determine whether the juice is worth the squeeze, if you will.Incremental sales is a commonly used KPI by many marketing executives to better understand the efficacy of their marketing campaigns. If you calculate your incremental sales and the number is positive, that’s a good thing. If it’s negative, it’s a great indicator that it’s time to revisit your marketing efforts and shake things up.
What is an Incremental Sales KPI?
When we describe a KPI, we are talking about key performance indicators. These are high level metrics that attempt to provide specific actionable insights for business leaders.The goal of an incremental sales KPI is to provide business leaders an actionable metric that determines if their marketing efforts are worth additional contribution. If the Incremental Sales KPI indicates that their campaigns are yielding more sales than if they had not done the campaign, then they can confidently acknowledge that their efforts were a success.
Understanding your company's high level goals, you must translate them into KPIs. These KPIs help you make strategic decisions and best allocate budget towards the different types of ads you want to run. We've created a helpful guide on the different types of advertising here.
The Incremental Sales KPI In Action
Let’s imagine that the International Pogo Stick Museum is conducting their annual sales review. Their business is centered around selling tickets to visitors of their museum. Often when people visit, they like to purchase food and small items from the gift shop.Their most recent marketing campaign was centered around a Facebook ad they ran with a video to promote their museum. Throughout the previous year, they spent $10,000 running the ad. Luckily for them, the ad received lots of clicks and conversions on their site.
Throughout the past year, they saw growth in new users, an increase in sessions per user and more ticket sales sold online. They were excited about the results, but wanted to better understand if it was a direct result of the ad or if their museum’s reputation is growing through word of mouth and recent press. The question they are looking to answer is, how to measure incremental sales?
How to Calculate Incremental Sales
Total Sales - Baseline Sales = Incremental Sales
To measure incremental sales we simply calculate the difference between your total sales and your baseline sales. Baseline sales are a measure of your company’s expected sales revenue, with no additional boost from marketing efforts.
How to Determine your Business’s Baseline Sales
Unfortunately, you as the business owner are going to have to make some educated guesses and assumptions about your baseline sales in order to calculate them. One factor to consider is your annual average sales revenue growth. This number provides the basis for comparison. One method would be to consider the past 3-5 years of sales revenue and look at the growth each year to predict what you would have expected your sales to be in the next year. This number would be the current year’s sales revenue minus the previous year’s sales revenue. For example: Based on our table below, 2018’s sales growth would have been $50,000 (2018 SR - 2017 SR).
Note that this example assumes paid marketing efforts were limited or nonexistent in past years. If you did spend money on advertising in prior fiscal years, you will have to return to the educated guess model and work to subtract ad-based revenue from your total sales to arrive at a baseline number.
Assuming last year was the first year your company spent money on advertising efforts, you may move forward with this example model. In the case of The International Pogo Stick Museum, their sales grew slowly around $50,000 in additional revenue each year with $0 spent on advertising. We’ve plotted their sales over the last 4 years below.
As you can see their sales had been growing by $50,000 per year at a very steady rate, but when they spent $10,000 on ads in 2020, their revenue grew by $100,000. A huge mistake would be to attribute all $100,000 to the Facebook Ad. It’s more reasonable to expect that a number close to $50,000 would be coming from their expected baseline growth, and that the Facebook Ad is responsible for a number closer to $50,000.
Imagine if the total sales revenue had only been $500,000 in 2020. If the museum’s digital marketer failed to recognize the baseline sales revenue, they may falsely believe that their campaign drove $50,000 in revenue when the business was likely to already capture some of those sales.
So let’s review:
Incremental ($50,000)
With all of this information and a solid incremental sales number, the International Pogo Stick Museum can rest assured that their marketing efforts on Facebook ads were a success. Their more nuanced reporting of this KPI can help them better understand where sales growth came from that was not trackable inside of the Facebook Ads Manager.
Why is it Important to Track Incremental Sales?
The primary reason we are interested in incremental sales, is to understand what effect our advertising dollars had on total sales growth. In performance (digital) marketing we create campaigns that are trackable with software through pixels, attribution models, and UTMs. These digital techniques do a great job, but at the end of the day they are far from perfect.If someone sees a video on Facebook, likes what they see, gets distracted and later tells a friend about the International Pogo Stick Museum, that Facebook ad may have been responsible, but we can’t concretely measure it. There are countless different ways someone could be affected by a digital ad and act later in a way that isn’t measurable. Measuring incremental sales works in tandem with more typical performance marketing tools like UTMs to help you better understand the impact of your efforts and measure what you can.
Key Terms and Metrics That Help Explain Incremental Sales
To accurately determine the value of your incremental sales, it’s important to have a detailed understanding of a few other key performance indicators. Key Terms to Understand:
- Baseline Sales: The sales revenue number you’d expect your business to produce for the given time period (remember to consider seasonality).
- Leads: An individual that has expressed interest in your product or service by completing a goal
- Wins: New customers generated by a marketing campaign
- Campaign: A marketing effort dedicated towards getting a target audience to complete a desired business action.
At the end of the day, this method is a tool for your marketing toolbox, just like any other. Try it out and see if it works for you!
About the Author
Matt Schott is a Digital Marketing Strategist at thunder::tech, who specializes in marketing automation and leverages data visualizations to help clients quickly grasp the whole story. In his free time, Matt is a reader of books, climber of rocks and player of guitars.